Combining Welles Wilder's RSI, ADX and SAR Indicators


Combining Welles Wilder's RSI, ADX and SAR Indicators

THREE TIMES WILDER: RSI, ADX AND SAR COMBINED

Many swing traders have applied RSI, ADX and Parabolic SAR to their stock chart analysis. What they may not realize, is that all of these indicators were designed by one individual: J. Welles Wilder Jr.

Welles Wilder is arguably one of the greatest technical analysts of the late 20th century. His quest as a trader was to define mathematical formulas that would lead to profitable trading systems. In his book New Concepts in Technical Trading Systems (ISBN #0-89459-027-8), Wilder created six indicators for use in trending and non-trending markets. All of these indicators were original and were designed as stand-alone trading systems. The ones which have achieved the greatest popularity are RSI, ADX and Parabolic SAR. These are included in virtually every technical analysis software package I have examined as well as technical analysis web-sites of any sophistication.

In the next Inside The Black Box, I plan to start a detailed series on the work of Welles Wilder, beginning with RSI -- the easiest of the three indicators to grasp. From there I will go on to ADX. The rationale behind ADX is very complex and detailed. Tracing Wilder's logic is, in itself, a learning experience about market behavior. I have also found a number of original ADX visual patterns that I will share with subscribers at that time. Finally, we will analyze Parabolic SAR, and learn how it provides a helpful way to set stop losses.

Since I will later be analyzing each of these indicators in depth, to introduce them I will just provide thumbnail sketches, with a focus on the trading signals they provide. I will then comment on how synthesizing the message of the three can add to their value. The analysis will be applied to Intel (INTC, $24.16) a stock in our portfolio.

Most readers of the Swing Trader are familiar with RSI or the Relative Strength Index. The calculation of this indicator compares the average of up and down closes over a specific time usually 14 periods (a period can be an hour, day, week etc). RSI works primarily as an oversold/overbought indicator. A stock is oversold when it reaches the 30 level or goes below it. It is overbought when RSI exceeds 70. Stocks can stay oversold or overbought for long periods of time. Therefore, if RSI has crossed the 30 or 70 "boundary", no action should be taken until it has re-crossed it in the opposite direction. For example, if RSI falls below 30, do not buy until the indicator has come back above that level.

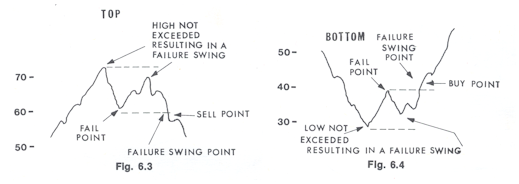
As with many overbought/oversold indicators, an important signal is given by bearish or bullish divergence. Bullish divergence occurs when RSI approaches 30 and begins to rise even though price continues to decline. That tells the trader the momentum of the decline is decreasing. Bearish divergence happens when RSI approaches 70 and the indicator begins to decline even through price is rising.

The 50 level is also important in RSI analysis. That is where the up vs. down closes in the indicator are in equilibrium or balance. Crosses below 50 indicate a weakening of the stock and those above 50 signify strengthening.

In New Concepts, Wilder implied that he considered ADX his master achievement to that time. ADX stands for average directional index. It is an indicator which is not easily or intuitively grasped. As a result, most traders find it puzzling and do not use it. One major function of ADX is to determine whether a stock should be traded using a trend-following or non-trend-following approach.

The ADX indicator consists of three lines +DI (green), -DI (red) and ADX itself (black). When ADX is below 20, it shows the lack of a clear trend. Trend-following systems such as moving averages should not be used as they will give alternating buy and sell signals or "whip-saws" causing losses. When ADX crosses above the 20 line, it is time to employ trend-following systems. When the ADX line reaches 40, it is warning that the stock is becoming overbought. When the ADX line itself peaks above that level, it is usually time to start nailing down profits.

The ADX buy signal is given when +DI crosses above –DI. I find the signal should generally be disregarded if +/- DI cross and re-cross in rapid succession. After a crossover, if the black ADX line crosses 20, it is a strong sign of an emerging trend. The sell signal is the reverse. Although ADX gives signals later than other indicators, such as stochastics or CCI, what it lacks in speed it makes up for in reliability.

Parabolic SAR is an indicator I use regularly, but have not displayed in previous Swing Trader issues because it can make moving averages hard to detect. The SAR stands for stop and reverse. It is called Parabolic SAR because the dots below and above the candles take the shape of a parabola or French curve. When the dots are below a stock's price the swing trader should be long. Conversely, when they go above its price, the swing trader should reverse his or her position and go short. With SAR, the trader always has a position in the market. SAR, however, will create whip-saws during periods of consolidation and its messages should not be traded on exclusively. Wilder also comments that if ADX is on a buy signal, only the long signals in SAR should be acted on.

SAR is designed to keep stop-loss levels rising as a stock's price hits new highs in an uptrend. This is because of a mathematical formula called an "acceleration factor", which raises the stop as the trend matures, thereby locking-in profits. Note that at the beginning of a trend, when the dots are below the stock price, they are close together. As the trend extends over time, they are further apart, reflecting that the stop-loss moves to ever-higher levels.

These thumbnail sketches will be expanded in detail in future newsletters. Applying the three indicators to Intel, several observations can be made. In the period from September 7th to 27th, RSI showed bullish divergence as Intel's price went lower, but RSI bounced off the oversold 30 level and rose. This bullish divergence warned the worst of the downtrend was over. Around September 20th, SAR gave a buy signal when the dots went below share price, but this signal should have been ignored since ADX remained on a sell signal.

Through early October to about October 18th, Intel was stuck in sideways consolidation. Note the frequent whip-saws in both ADX and SAR. RSI consolidated near the 50 line, reflecting the equilibrium of up and down closes in price. During this time, there were no clear trend-following signals available and trend-following systems should have been avoided.

That picture changed just after October 18th. Near that time, in rapid succession, ADX gave a buy signal. The parabolic SAR dots went from below the share price to above. RSI broke out above the 50 level and stayed there. In the next several days, the black ADX line began to slope upward from under 20, a sign of a strengthening uptrend. In classical technical analysis terms, the stock neared completion of a multi-month basing pattern. Strong positive signals were given near the end of October, when the black ADX line rose above 20, and the stock completed its basing pattern just above $22.

What trading guidance do the three indicators now provide? First, the stock is very overbought. ADX is at 39, just below the critical 40 level. RSI hit 79 on Thursday, before dropping to 67 the next day, showing INTC's retreat from a very overbought state. The SAR dots are still below the stock's price, so INTC should be held long from the perspective of this indicator. But note how the dots are getting very close to the share price. SAR says that if Intel falls below $23.69, then profits should be taken. A short position should not be established, since ADX is still on a buy signal.

Although Wilder does not himself suggest combining RSI, ADX and SAR, synthesizing their messages makes them that much more powerful. One might say that they are three times wilder than before.

Good trading!

merry christmas

love Viet Nam

love Viet Nam

NTV


Trương Ngọc Ánh

A SIMPLE TRADING SYSTERM


Sử dụng 2 đường MA5 và MA 10.
_Mua : khi price cut MA10.
_Bán : Khi price cut MA5.
// simple trading system
Buy = Cross( C, MA( C, 10 ) );
Sell = Cross( MA( C, 5 ), C );
Cover = Buy;
Short =Sell;
Plot(C,"",IIf(C>Ref(C,-1),colorGreen,colorRed),styleLine);
Plot(MA( C, 10 ),"MA10",colorWhite,styleLine);
Plot(MA( C, 5 ),"MA5",colorYellow,styleLine|styleThick);
shape = Buy * shapeUpArrow + Sell * shapeDownArrow;
PlotShapes( shape, IIf( Buy, colorGreen, colorRed ), 0, IIf( Buy, Low, High ) );

Ticker Trade Date Close
ASP Sell 12/26/2008 13.4000
ASP Short 12/26/2008 13.4000
BBC Sell 12/26/2008 13.9000
BBC Short 12/26/2008 13.9000
BPC Buy 12/26/2008 9.8000
BPC Cover 12/26/2008 9.8000
BTH Sell 12/26/2008 8.5000
BTH Short 12/26/2008 8.5000
CAN Sell 12/26/2008 9.8000
CAN Short 12/26/2008 9.8000
CDC Buy 12/26/2008 20.8000
CDC Cover 12/26/2008 20.8000
CID Sell 12/26/2008 7.5000
CID Short 12/26/2008 7.5000
CJC Buy 12/26/2008 18.5000
CJC Cover 12/26/2008 18.5000
CMC Sell 12/26/2008 8.4000
CMC Short 12/26/2008 8.4000
CTN Sell 12/26/2008 11.5000
CTN Short 12/26/2008 11.5000
DAE Buy 12/26/2008 11.2000
DAE Cover 12/26/2008 11.2000
DIC Buy 12/26/2008 13.8000
DIC Cover 12/26/2008 13.8000
DRC Buy 12/26/2008 17.4000
DRC Cover 12/26/2008 17.4000
DST Buy 12/26/2008 7.6000
DST Cover 12/26/2008 7.6000
FMC Buy 12/26/2008 11.9000
FMC Cover 12/26/2008 11.9000
HAX Buy 12/26/2008 14.2000
HAX Cover 12/26/2008 14.2000
HBD Buy 12/26/2008 10.1000
HBD Cover 12/26/2008 10.1000
HJS Buy 12/26/2008 10.8000
HJS Cover 12/26/2008 10.8000
HMC Buy 12/26/2008 11.9000
HMC Cover 12/26/2008 11.9000
HRC Sell 12/26/2008 23.1000
HRC Short 12/26/2008 23.1000
ICF Buy 12/26/2008 6.8000
ICF Cover 12/26/2008 6.8000
IFS Sell 12/26/2008 7.6000
IFS Short 12/26/2008 7.6000
ILC Buy 12/26/2008 14.0000
ILC Cover 12/26/2008 14.0000
KHP Buy 12/26/2008 9.7000
KHP Cover 12/26/2008 9.7000
KMF Buy 12/26/2008 6.4000
KMF Cover 12/26/2008 6.4000
L43 Buy 12/26/2008 15.8000
L43 Cover 12/26/2008 15.8000
LSS Buy 12/26/2008 14.4000
LSS Cover 12/26/2008 14.4000
LUT Sell 12/26/2008 10.7000
LUT Short 12/26/2008 10.7000
MCV Buy 12/26/2008 8.7000
MCV Cover 12/26/2008 8.7000
NAV Buy 12/26/2008 9.7000
NAV Cover 12/26/2008 9.7000
NBC Buy 12/26/2008 31.0000
NBC Cover 12/26/2008 31.0000
NKD Sell 12/26/2008 24.9000
NKD Short 12/26/2008 24.9000
NST Sell 12/26/2008 11.4000
NST Short 12/26/2008 11.4000
NTL Buy 12/26/2008 33.8000
NTL Cover 12/26/2008 33.8000
PGS Buy 12/26/2008 10.4000
PGS Cover 12/26/2008 10.4000
PIT Sell 12/26/2008 12.0000
PIT Short 12/26/2008 12.0000
PLC Sell 12/26/2008 21.0000
PLC Short 12/26/2008 21.0000
PMS Sell 12/26/2008 18.1000
PMS Short 12/26/2008 18.1000
POT Sell 12/26/2008 8.2000
POT Short 12/26/2008 8.2000
PPG Sell 12/26/2008 10.2000
PPG Short 12/26/2008 10.2000
PTS Buy 12/26/2008 14.3000
PTS Cover 12/26/2008 14.3000
PVE Buy 12/26/2008 15.8000
PVE Cover 12/26/2008 15.8000
QNC Buy 12/26/2008 22.5000
QNC Cover 12/26/2008 22.5000
RIC Sell 12/26/2008 17.2000
RIC Short 12/26/2008 17.2000
S12 Sell 12/26/2008 10.6000
S12 Short 12/26/2008 10.6000
S64 Buy 12/26/2008 12.8000
S64 Cover 12/26/2008 12.8000
SAF Buy 12/26/2008 18.9000
SAF Cover 12/26/2008 18.9000
SDD Buy 12/26/2008 7.9000
SDD Cover 12/26/2008 7.9000
SFC Sell 12/26/2008 47.5000
SFC Short 12/26/2008 47.5000
SGT Sell 12/26/2008 25.5000
SGT Short 12/26/2008 25.5000
SHC Buy 12/26/2008 19.2000
SHC Cover 12/26/2008 19.2000
SIC Sell 12/26/2008 14.6000
SIC Short 12/26/2008 14.6000
SJ1 Sell 12/26/2008 12.1000
SJ1 Short 12/26/2008 12.1000
SJD Buy 12/26/2008 14.0000
SJD Cover 12/26/2008 14.0000
SNG Buy 12/26/2008 20.5000
SNG Cover 12/26/2008 20.5000
TCM Buy 12/26/2008 8.7000
TCM Cover 12/26/2008 8.7000
TCR Sell 12/26/2008 7.8000
TCR Short 12/26/2008 7.8000
TNA Sell 12/26/2008 15.8000
TNA Short 12/26/2008 15.8000
TNG Buy 12/26/2008 12.8000
TNG Cover 12/26/2008 12.8000
TRI Buy 12/26/2008 7.7000
TRI Cover 12/26/2008 7.7000
TS4 Buy 12/26/2008 8.0000
TS4 Cover 12/26/2008 8.0000
TSC Buy 12/26/2008 32.3000
TSC Cover 12/26/2008 32.3000
TTF Sell 12/26/2008 12.9000
TTF Short 12/26/2008 12.9000
TTP Buy 12/26/2008 17.7000
TTP Cover 12/26/2008 17.7000
TYA Buy 12/26/2008 11.1000
TYA Cover 12/26/2008 11.1000
UNI Buy 12/26/2008 12.7000
UNI Cover 12/26/2008 12.7000
VC2 Sell 12/26/2008 31.4000
VC2 Short 12/26/2008 31.4000
VC7 Sell 12/26/2008 10.5000
VC7 Short 12/26/2008 10.5000
VHG Sell 12/26/2008 6.4000
VHG Short 12/26/2008 6.4000
VIS Buy 12/26/2008 23.9000
VIS Cover 12/26/2008 23.9000
VMC Buy 12/26/2008 27.0000
VMC Cover 12/26/2008 27.0000
VNINDEX Buy 12/26/2008 304.4600
VNINDEX Cover 12/26/2008 304.4600
VSH Sell 12/26/2008 27.6000
VSH Short 12/26/2008 27.6000

Our Beautiful World

Our Beautiful World

7 Chart Patterns That Consistantly Make Money

7 Chart Patterns That Consistantly Make Money

HTL


Paris Hilton


Thinking about my systerm


Shu Qi

Thư Kỳ mở lòng kể về thời đóng phim con heo. Ảnh: 163.

RẠNG RỠ HNH


Combine RSI and Stochastic

Time frame: Any.
Indicators: 5 EMA, 10 EMA, Stochastic (14, 3, 3), RSI (14, 70, 30)

Entry rules: Buy when 5 EMA crosses above 10 EMA and Stochastic lines are heading north (up) and Stochastic is not in overbought position (above 80.00 level) and RSI is above 50.

Entry rules: Sell when 5 EMA crosses below 10 EMA and Stochastic lines are heading south (down) and Stochastic is not in oversold position (below 20.00 level), and RSI is below 50.
Exit rules: when 5 EMA and 10 EMA cross in the opposite direction or if RSI crosses the 50 mark again.

FOREX TRADING SYSTEM

Stochastic Indicator

Quick Summary

Trading with Stochastic indicator involves the following signals:

Stochastic lines cross — indicates trend change.
Stochastic readings above 80 level — currency pair is overbought,
Stochastic staying above 80 level — uptrend is running strong.
Stochastic exiting 80 level downwards — expect a correction down or beginning of a downtrend.
Same for readings below 20 level — currency pair is oversold,
staying below 20 — doentrend is running strong,
exiting upwards above 20 — expect an upward correction or a beginning of an uptrend.

Details

The idea behind Stochastic indicator

The main idea behind Stochastic indicator according to its developer, George Lane, lies in the fact that rising price tends to close near its previous highs, and falling price tends to close near its previous lows.

How to interpret Stochastic indicator

Stochastic is a momentum oscillator, which consists of two lines: %K - fast line, and %D - slow line. Stochastic is plotted on the scale between 1 and 100.
There are also so called "trigger levels" that are added to the Stochastic chart at 20 and 80 levels. Those lines suggest when the market is oversold or overbought once Stochastic lines pass over them.

How to trade with Stochastic indicator

Let’s look at three methods of trading with Stochastic indicator.

Method 1. Trading Stochastic lines crossover

This is the simplest and common method of reading signals from Stochastic lines as they cross each other. Stochastic %K and %D line work similar to moving averages and:
when %K line from above crosses %D line downwards traders open Buy orders.
when %K line from below crosses %D line upwards traders Sell.

Stochastic lines crossovers that happen above 80% level and below 20% level are treated as strongest signals, compare to crossovers outside those levels.

Traders may choose sensitivity of their Stochastics. The smaller the Stochastic parameters, the faster it will react to market changes, the more crossovers will be shown.

Sensitive Stochastic (for example 5, 3, 3) is useful for observing rapidly changing market trends. But because it is too choppy it should be traded in combination with other indicators to filter out Stochastic signals.

Stochastic lines crossover

Method 2. Trading Stochastic oversold/overbought zones

Stochastic by default has 80% level, above which market is treated as overbought, and 20% level, below which market is considered oversold.

It is important to remember that while in sideways moving market a single Stochastic lines crossover that occur above 80% or below 20% will most of the time result in a fast predictable trend change, in trending market could mean just nothing. When price is trending well, Stochastic lines may easily remain in overbought/oversold zone for a long period of time while crossing there multiple times.

That’s why a method of trading overbought/oversold zones stands up. The rules here are to wait until Stochastic lines after being in overbought/oversold zone come out from it. E.g. When stochastic was trading for some time in overbought zone – above 80% level, traders wait for the lines to slide down and eventually cross 80% level downwards before considering to take Short positions. Opposite for Long positions: wait till Stochastic lines come into the oversold zone (below 20% level); wait further until Stochastic lines eventually cross 20% level upwards; initiate a buy order once Stochastic lines are firmly set, e.g. a trading bar is closed and Stochastic lines cross over 20% mark is fixed.

Trading Stochastic overbought/oversold levels

Method 3. Trading Stochastic divergence

Traders are looking for a divergence between Stochastic and the price itself. At times when the price is making new lows while Stochastic produces higher lows creates dissonance in the picture. It is called divergence. Divergence between price and Stochastic readings suggest a forming weakness of a main trend and therefore its possible correction.

Trading Stochastic divergence

Full versus Fast versus Slow stochastic

Full Stochastic inidcator has 3 parameters, like: Full Stoch (14, 3, 3), where the first and the last parameters are identical to those found in Fast and Slow Stochastic:
the first parameter is used to calculate %K line, while the last parameter represents the number of periods to define %D - signaling line.
The difference between Full and other Stochastics lies in the second parameter, which is made to add smoothing qualities for %K line. Applying this smoothing factor allows Full Stochastic be a bit more flexible for chart analysis.

How to read Momentum Indicators

With Momentum indicators stock traders look for controversy between chart prices and Indicator suggestions:

A. directional divergence between the price and momentum signals of a trend's developing weakness.

B. price spikes that occur during weak momentum, are the last warning signals of the trend change.

C. also trend change should be expected during sideways moving prices and controversially strong momentum.

Momentum indicators, such as RSI and Stochastic, are favorite indicators for non-trending markets. Momentum indicators ideally gauge whether the market is overbought or oversold during its non-trending state, and highlight potential reversal points before those actually occur.

Quick Summary

Trading with RSI indicator involves the following signals:

RSI moving above 50 level — uptrend is confirmed, below 50 — downtrend is confirmed.
RSI peaking above 70 level — market is overbought.
RSI staying above 70 level — uptrend is running strong.
RSI exiting 70 level — downtrend is underway, or at least a correction down is due.

Same for RSI falling below 30:
below 30 — market is oversold,
staying below 30 — downtrend is running strong,
exiting above 30 — uptrend is underway, or at least an upward correction is due.

RSI diverging from price on the chart — an early warning of a possible trend change.

RSI divergence explained

Ngo Thanh Van so hot !

METASTOCK FORMULAS

New
Additions

Where Bear Dares 1
From PSChakravarthy

Div(Div(O-L-H-C,2)+Div(O+L+H+C,4),2);0

{Swing Or Close,at -ve Value,"Bull"; At +ve Value the end of Bull.}

Where Bear Dares 2
From PSChakravarthy

Div(O-L-H-C,2)

{Bear Dares Below this value}


Zigzag Validity Indicator

Spyros Raftopoulos

1=valid last leg of zig,

-1=invalid last leg of zig.

DO NOT use this indicator in systems}

perc:=Input("Percent",0.2,100,10);

Z:=Zig(C,perc,%);

last:=ValueWhen(1,

( Z > Ref(Z,-1) AND Ref(Z,-1) <>

OR

( Z <> Ref(Z,-2) ),

Ref(Z,-1));

pc:=(C-last) * 100 / last;

pc:= Abs(pc);

SD:=(z>Ref(z,-1) AND Ref(z,-1)>Ref(z,-2)) OR (z

Ref(z,-1)

res:=If(pc>=perc ,1,0);

res:= If(Alert(res,2) AND SD,1,res);

res

3 Minute Bar Breakout

{Functions used in Middle Screen}

MiddleScreenBlue := Mov( Close, 34, E )

MiddleScreenYell := Mov( Open, 13, E )

{Functions used in Lower Screen}

StochRed := Stoch( 9, 7 )

StochLagging : = Mov( StochRed, 7, S )

{ Main analysis section }

{BULLISH}

Cross( StochRed, StochLagging ) AND ( MiddleScreenYell > MiddleScreenBlue )

{BEARISH}

Cross( StochLagging, StochRed ) AND ( MiddleScreenYell <>

{ Breakout Notifier }

UpperSupportNow := Mov( OPEN, 10, E )

LowerSupportNow := Mov( CLOSE, 8, E )

PrevUpperSupport := Ref( Mov( OPEN, 10, E ), -1 )

PrevLowerSupportNow := ref( Mov( CLOSE, 8, E ), - 1 )

TRUE := 1

FALSE := 0

SignalledHigh := FALSE

SignalledLow :=FALSE

{ BULLISH }

IF ( ( L > UpperSupportNow ) AND ( Ref( L, -1 ) > PrevUpperSupport ) AND

SignalledHigh = FALSE )

THEN

SignalledHigh := TRUE

IF ( SignalledHigh = TRUE )

THEN

SignalledLow :=FALSE

{BEARISH}

IF ( ( H <> PrevLowerSupport ) AND

SignalledLow = FALSE )

THEN

SignalledLow := TRUE

IF ( SignalledLow = TRUE )

THEN

SignalledHigh := FALSE

Sean Plows

Panic Selling

sqrt(((buyp()/sellp())/rsi(2))) > ref(((buyp()/sellp())/rsi(2)),-1)

Guido Cereia (Torino)

Italia

1-2-3 High or Low

www.fib-charting.it

LOW

Mx:=Mov(L,4,S);

L > Ref(L,-1) AND L>Mx AND

Ref(L,-1) <>

LLV(L,4 ) > LLV(L,10 ) AND

RSI(14)<50

HIGH

Mx:=Mov(H,4,S);

H <>

Ref(H,-1) > Ref(Mx,-1) AND

HHV(H,4 ) <>

RSI(14)>50

KA Money Flow System

by Karim Anwar

This system is based on Money Flow Index . It is a developing system and will like input from other readers to improve it> Thanks for any suggestions to improve it.

It tries to buy when MFI is starting to rally from an oversold state and sells short when MFI starts falling from overbought state.

Can any body help to form an exploration to find stocks for whom this system will work best ?

EnterLong: Cross(MFI(23), (LLV(MFI(23),23) + opt1)) AND MFI(23)<50

closeLong: MFI(23)=LLV(MFI(23),23)

longOptimisationFullDetails: OPT 1 = Min. 5 Max. 20 Step: 1

enterShort: Cross( (HHV(MFI(23),23) - opt1), MFI(23))AND MFI(23)>50

closeShort: MFI(23)=HHV(MFI(23),23)

ShortOptimisationFullDetails: OPT 1 = Min. 5 Max. 20 Step: 1

Presto's Magic Box
(a tweaked version of the Darvis Box)

Jason Prestwidge

Periods:=Input("periods",1,260,100);

Topbox:=If(Ref(H,-3)>=Ref(HHV(H,Periods),-4) AND Ref(H,-2)

Botbox:=If(Ref(H,-3)>=Ref(HHV(H,Periods),-4) AND Ref(H,-2)

Botbox;

Topbox;

MACD Histogram Divergence

This explorer looks for stocks exhibiting extreme divergence from the MACD Histogram. In his book "Trading for a Living", Alexander Elder argues that divergence from the MACD Histogram gives the strongest signals in the whole of technical analysis.

ColA:

md := MACD();

mdhist := md - Mov(md,9,E);

Correl(((Sum(Cum(1)*( mdhist ),100))-(Sum(Cum(1),100)*

Sum(( mdhist ),100)/100))/((Sum(Power(Cum(1),2),100))-

(Power(Sum(Cum(1),100),2)/100)),((Sum(Cum(1)*C,100))-(Sum(Cum(1),100)*

Sum(C,100)/100))/((Sum(Power(Cum(1),2),100))-(Power(Sum(Cum(1),100),2)/100)

),12,0)

Filter Column:

colA and colA <-0.8

The above formula can also be combined with a volatility buy signal and a volume signal. The following addition is then made.

ColB: The volatility buy signal

H > Ref(C,-1) + 1.8 * Ref( ATR(10),-1)

ColC: Volume 10% above the average of the previous 10 days

V > 1.1 * Ref( Mov(V,10,E),-1)

Filter Column:

colA AND colB AND colC AND colA <-0.80

Initial tests with this system have been encouraging.

Denis Mortell


1 2 3 Ross Hook

http://www.fib-charting.it

Col A: Peak(1,H,10)<=1.1*Peak(2,H,10)

AND Peak(1,H,10)>=0.9*Peak(2,H,10)

AND Trough(1,L,10)>=1.1*Trough(2,H,10)

AND Trough(1,L,10)<=0.9*Trough(2,H,10)

AND LLV(L,25)

Col B: Peak(1,H,5)<=1.1*Peak(2,H,5)

AND Peak(1,H,5)>=0.9*Peak(2,H,5)

AND Trough(1,L,5)>=1.1*Trough(2,H,5)

AND Trough(1,L,5)<=0.9*Trough(2,H,5)

AND LLV(L,25)

Col C: Peak(1,H,1)<=1.1*Peak(2,H,1)

AND Peak(1,H,1)>=0.9*Peak(2,H,1)

AND Trough(1,L,1)>=1.1*Trough(2,H,1)

AND Trough(1,L,1)<=0.9*Trough(2,H,1)

AND LLV(L,25)

Filter colA=1 OR colB=1 OR colC=1

Guppy MMA Oscillator

by Jason Prestwidge

((Mov(CLOSE,3,E)+Mov(CLOSE,5,E)+
Mov(CLOSE,8,E)+Mov(CLOSE,10,E)+
Mov(CLOSE,12,E)+Mov(CLOSE,15,E))-
(Mov(CLOSE,30,E)+Mov(CLOSE,35,E)+
Mov(CLOSE,40,E)+Mov(CLOSE,45,E)+
Mov(CLOSE,50,E)+Mov(CLOSE,60,E)))*10;
(Mov((Mov(CLOSE,3,E)+Mov(CLOSE,5,E)+
Mov(CLOSE,8,E)+Mov(CLOSE,10,E)+
Mov(CLOSE,12,E)+Mov(CLOSE,15,E))-
(Mov(CLOSE,30,E)+Mov(CLOSE,35,E)+
Mov(CLOSE,40,E)+Mov(CLOSE,45,E)+
Mov(CLOSE,50,E)+Mov(CLOSE,60,E)),13,E))*10;0;

Combine indicator

Trend Indicators
Use trend indicators to determine future direction and trend.
(Xác định xu hướng của thị trường)
1. Directional Movement System.
2. MACD.
3. TRIX indicator.
4. Parabolic SAR.
5. MA
6. Commodity Channel Index CCI
Volume Indicators Use volume indicators to confirm the strength of the trend:
Xác nhận sức mạnh của xu hướng , nếu volume indicators trở nên yếu đi thì có thể đó là sự cảnh báo sự đảo chiều 1. Volume Oscillator.
2. On Balance Volume.
3. Chaikin Oscillator.
4. Money Flow Index.
5. Compare Range and Volume.
Momentum Indicators
Use momentum indicators to determine the speed at which price is changing.
(Đo tốc độ thay đổi của giá) 1. Relative Strength Index RSI.
2. Rate of Change (Price).
3. Momentum.
4. Stochastic.
5. Williams %R.
Volatility Indicators
Volatility indicators is use to judge the strength of the trend and breakouts.
Đo mức độ dao động của giá: trend mạnh hay yếu 1. Bollinger Bands.
2. Volatility.
3. Chaikin Volatility.
4. Volatility Ratio.
5. Average True Range.
Trong đó trend là quan trọng nhất, khi bước chân vào thị trường ta phải biết xu hướng của thị trường đang là Downtrend hay Uptrend sau đó dùng thêm 1, 2 indicator khác để biết được xu hướng của trend để mua bán cho phù hợp.
Vd: ở cái chart của tôi dùng: Bolinger, MA20, Stoch, RSI và Volume avegare. Nếu tuân thủ đúng theo kỷ luật thì đã có thể thu vào lợi nhuận và từ khi Giá cắt xuống khỏi MA20 bám teo bbbot thi Stoch có mấy lần cắt lên khỏi 20 nhưng cũng không xuất hiện 1 uptrend do RSI không vượt qua được 50 và volume thì nhỏ hơn MAV.
Tóm lại ivệc sử dụng indicator nào và số lượng idicator là do mục đích của mỗi người nhưng theo tôi thì chỉ nên dùng 3,4 indicator để xác định xu tế tị trường và khi đã dùng nó thì ta phải hiể rõ bản chất của nó. Riêng phần momentum thì có thể sử dụng thêm 1 indicator nữa để confirm tín hiệu cho chắc chắn.


VNM_ Exit alert??

Vậy là sống sót qua T+, cash out chờ tín hiệu mới.

Technical Indicators

Technical indicators is a measurement metric used to determine future financial, stocks or economic trends. Indicators take price, time and volume as their input.

An indicator is a mathematical calculation of data point series based on a securities price and volume over a period of time, it may includes any combination of the open, close, high or low. The most common usage is using the closing prices to calculate the indicator. End of Day or EOD data are available to download by various EOD data provider either free of charges or paid services. The result of indicator data points are use to plot a chart to determine the trend of a market, the strength of the market and the direction of the market. In economic context, an indicator could be interest rate, unemployment rate, stock market

indicators such as MACD, RSI, etc...

Leading Indicators and Lagging Indicators

Leading indicators change before the underneath commodity change, lagging indicators behind or follow the event.

The main benefits of leading indicators is the early signaling for entry and exit, it generate more signals and allow more opportunities to trade in trading markets. On the other hand, more signals and earlier signals mean that the changes of false signals will also increase that might increase the potential losses.

Lagging indicators follow the price action and are also known as trend-following indicators. Trend-following indicators work best when markets or securities develop a strong trends and signal traders to take long position and keep them holding the position as long as the trend is intact. Trend indicators are not effective in trading or sideways markets and tend to lead to many false signals. Late signal that cause late entry is the only disadvantage of trend-following indicators.

If you increase the sensitivity of an indicator, it will produce early signals but generate more false signal as well. If you prolong the time period to reduce the false signal, the sensitivity will decrease and yield a lagging indicator.

Select indicators from difference category base on difference input is the best way to avoid Multicollinearity trap and Sycophants traps.

Multicollinearity is a statistical term refer to unknowingly uses the same type of indicator or information more than once, This is a common mistake in technical analysis.

Arrange and group technical indicators in categories to keep you away from multicollinearity problem. Here is the four categories of popular technical indicators.

Trend Indicators

Use trend indicators to determine future direction and trend.

1. Directional Movement System.

2. MACD.

3. TRIX indicator.

4. Parabolic SAR.

5. Moving Average

.

6. Commodity Channel Index CCI

Volume Indicators

Use volume indicators to confirm the strength of the trend.

1. Volume Oscillator.

2. On Balance Volume.

3. Chaikin Oscillator.

4. Money Flow Index.

5. Compare Range and Volume.

Momentum Indicators

Use momentum indicators to determine the speed at which price is changing.

1. Relative Strength Index RSI.

2. Rate of Change (Price).

3. Momentum.

4. Stochastic.

5. Williams %R.

Volatility Indicators

Volatility indicators is use to judge the strength of the trend and breakouts.

1. Bollinger Bands.

2. Volatility.

3. Chaikin Volatility.

4. Volatility Ratio.

5. Average True Range.


The Trend is your Friend

TRADERS’ BIGGEST PROBLEM

Trading is likely the most exciting way to make a living and/or accumulate a fortune. You are your own boss and your own worst enemy. You alone must deal with the frustration of your own choices. If you lose, there is no one else to blame. You made the losing decision, even if that decision was to let someone else make your decision or to follow someone else’s approach. On the other hand, if you win, don’t have to say “Thank you” to anyone. You are not obliged to anyone but yourself. There is no politics nor anyone to whom you must cater. You are truly “sliding down the razor blade of life.”

But here is the problem. Most of the time, the market goes nowhere. Only 25 to 40 percent of the time does the market trend, during the remaining 60 to 75 percent of the time the market goes nowhere. Most professional traders make nearly all of their profits in a trending market.

Here is our problem: we don’t want to spend out time entering and exiting a market that is going nowhere. If the market is going nowhere, then the opportunity is NO-WHERE. We want to change that to opportunity is NOW-HERE.

The Trend is your Friend

Weekly Chart of BHEL showing a three year trading range which finally breaks out into a trend.


TREND AND TRADING RANGE

Traders try to profit from changes in prices: Buy low and sell high or sell short high and cover low. Even a quick look at a chart reveals that markets spend most of their time in trading ranges. They spend less time in trends.

A trend exits when prices keep rising or falling over time. In an uptrend, each rally reaches a higher high than the preceding rally and each decline stops at a higher level than the preceding decline. In a downtrend each decline falls to a lower low than the preceding decline and each rally stops at a lower level than the preceding decline and each rally stops at a lower level than the preceding rally. In trading range most rallies stop at about the same high and declines peter out at about the low.

A trader needs to identify trends and trading ranges. It is easier to trade during trends than in trading ranges.


PSYCHOLOGY OF TRENDS AND TRADING RANGE

An uptrend emerges when bulls are stronger than bears and their buying forces prices up. If bears manage to push prices down, bulls return in force, break the decline, and force prices to a new high. Downtrends occur when bears are stronger and their selling pushes markets down. When a flurry of buying lifts prices, bears sell short into that rally, stop it, and send prices to new lows.

When bulls or bears are equally strong or weak, prices stay in a trading range. When bulls manage to push prices up, bears sell short into that rally and prices fall. Bargain hunters step in and break the decline, bears cover shorts, their buying fuels a minor rally, and the cycle repeats.

Prices in trading ranges go nowhere, just as crowds spend most of their time in aimless mulling. Markets spend most of their time in trading ranges than trends because aimlessness is more common among people than purposeful action. When a crowd becomes agitated or excited, it surges and creates a trend.


THE HARD RIGHT EDGE

Identifying trends and trading ranges is one of the hardest tasks in technical analysis. It is easy to find them in the middle of the chart, but the closer you get to the right edge, the harder it gets.

Trends and trading ranges clearly stand out on old charts. Experts show those charts on seminars and make it seem easy to catch trends. Trouble is your broker does not allow you to trade in the middle of the chart. He says you must make your trading decisions at the hard right edge of the chart!

The past is fixed and easy to analyze. The future is fluid and uncertain. By the time you identify a trend, a good chunk of it is already gone. Nobody rings a bell when a trend dissolves into a trading range. By the time you recognize the change, you will lose some money trying to trade as if the market was still trending.

Most people cannot accept uncertainty. They have a strong emotional need to be right. They hang on to losing positions, waiting for the market to turn and make them whole. Trying to be right in the market is very expensive. Professional traders get out of losing trades fast. When the market deviates from your analysis, you have to cut losses without fuss or emotions.


THREE IMPORTANT TRENDS

You may be asking yourself the question, "What is a trend and how long does it last?" There are countless numbers of trends, but before the advent of intraday charts, there were three generally accepted durations: primary, intermediate and short-term.


The main or primary trend, is often referred to as a bull or bear market. Bulls go up and bears go down. They typically last about nine months to two years with bear market troughs separated by just under four years. These trends revolve around the business cycle and tend to repeat whether the weak phase of the cycle is an actual recession, or if there is no recession and just slow growth.

Primary Trend

Bull & Bear markets last approximately 4 years

Primary trends are not straight-line affairs, but are a series of rallies and reactions. These series of rallies and reactions are known as intermediate or medium term trends.

The intermediate or medium term trend can vary in length from as little as six weeks to as much as nine months, or the length of a very short primary trend.

Intermediate trends typically develop as a result of changing perceptions concerning economic, financial, or political events. It is important to have some understanding of the direction of the main or primary trend because rallies in bull markets are strong and reactions are weak. On the other hand, reactions in bear markets are strong and rallies are short, sharp, and generally, unpredictable.

If you have a fix on the underlying primary trend, you will be better prepared for the nature of the intermediate rallies and the reactions that will unfold.

In turn, intermediate trends can be broken down into short-term trends, which last from as little as two weeks to as much as five or six weeks.

Market Cycle Model

As an investor, it is best to accumulate when the primary trend is in the early stages of reversing from down to up, and liquidate when the trend is reversing from up to down. Second, as traders, we are better off if we position ourselves with the long side in a bull market since that is when short-term uptrends tend to have the greatest magnitude. By the same token, it does not usually pay to short in a bull market because declines can be quite brief and reversals to the upside unexpectedly sharp. If you are going to make a mistake, it is more likely to come from a counter-cyclical trade.


If you're an intraday trader, you may think all of this does not apply to you, but really, it does. It is important to remember that even on intraday charts, the predominant trend determines the magnitude and duration of the shorter moves. You may not feel a three-hour rally is closely related to a two-year primary bull market move, but it is just as related as a five or six-day trend.

Charles Dow, the author of the venerable Dow theory, stated at the turn of the century that the stock market had three trends. The long term trend lasted several years, the intermediate trend lasted several months and anything shorter than that was a minor trend. Robert Rhea, the great market technician of the 1930s, compared the three market trends to a tide, a wave and a ripple. He believed that traders should trade in the direction of the market tide and take advantage of the waves and the ripples to time your entry and exit.

CONFLICTING TIMEFRAMES

Most traders ignore the fact that markets usually are both in a trend and in a trading range at the same time! They pick one time frame such as daily or hourly and look for trades on the daily charts. With their attention fixed on daily or hourly charts, trends from other time frames, such as weekly or 10 minute trend keep sneaking up on them and wrecking havoc with their plans.

Markets exist in several time frames simultaneously. They exist on a 10 minute chart, an hourly chart, a daily chart, a weekly chart, and any other chart. Traders often feel confused when they look at charts in different time frames and they see the markets going in several directions at once. The market may look for a buy on a daily chart and a sell on the weekly chart, and vice versa. The signals in different time frames of the same market often contradict one another. Which of them will you follow? Most traders pick one time frame and close their eyes to others – until a sudden move outside of “their” time frame hits them.

A FACTOR OF FIVE

When you are in doubt of a trend, step back and examine the charts in a timeframe that is larger than the one you are trying to trade. A factor of 5 links all timeframes. If you start with the weekly charts and proceed to the dailies, you will notice that there are five trading days to a week. As your timeframe narrows, you will look at hourly charts – and there are approximately 5 to 6 trading hours to a trading day. Intra day traders can proceed even further and look at 10 minute charts, followed by 2 minute charts. All are related by a factor of five. The proper way to analyze any market is to analyze it in at least two time frames. If you analyze daily charts, you must first examine the weekly charts and so on. This search for greater perspective is one of the key principles of the Traders Edge Multiple Time Frame Trading System.

METHOD AND TECHNIQUES

There is no single magic method to identifying trends and trading ranges. There are several methods and it pays to combine them. When they confirm one another, their message is reinforced. When they contradict one another, it is better to pass up the trade.

  1. Analyze the pattern of highs and lows. When rallies keep reaching higher levels and declines keep stopping at higher levels they identify an uptrend. The pattern of lower lows and lower highs identifies a downtrend, and the pattern of irregular highs and lows points to a trading range.
  2. Draw an uptrendline connecting significant recent lows and a downtrendline connecting significant recent highs. The slope of the latest trendline identifies the current trend A significant high or low on a daily chart is the highest high or lowest low for at least a week. As you study charts, you become better at identifying those points. Technical analysis is partly a science and partly an art.
  3. The direction of a slope of a moving average identifies the trend. If a moving average has not reached a new high or low in a month, then the market is in a trading range.
  4. Several market indicators, such as MACD and the Directional system help identify trends. The Directional system is especially good at catching early stages of new trends.

CONCLUSION

Markets change, new opportunities emerge, and old ones melt away. Good traders are successful but humble people – they always learn. The primary purpose of the market is to find immediately the exact price where there is an equal disagreement on value and an agreement on price. Speculators get paid for buying what nobody wants when nobody wants it and selling what everybody wants when everybody wants it. Remember there is no such thing as a bad trader. There is only a well trained or badly trained trader.

Simplifying Elliott Wave Analysis

Elliott Wave analysis is a collection of complex techniques. Approximately 60 percent of these techniques are clear and easy to use. The other 40 are difficult to identify, especially for the beginner. The practical and conservative approach is to use the 60 percent that are clear.

When the analysis is not clear, why not find another market conforming to an Elliott Wave pattern that is easier to identify?

From years of fighting this battle, we have come up with the following practical approach to using Elliott Wave principles in trading.

The whole theory of Elliott Wave can be classified into two parts:

Impulse patterns
Corrective patterns

Elliott Wave Basics — Impulse Patterns
The impulse pattern consists of five waves. The five waves can be in either direction, up or down. Some examples are shown to the right and below.The first wave is usually a weak rally with only a small percentage of the traders participating. Once Wave 1 is over, they sell the market on Wave 2. The sell-off in Wave 2 is very vicious. Wave 2 will finally end without making new lows and the market will start to turn around for another rally.

The initial stages of the Wave 3 rally are slow, and it finally makes it to the top of the previous rally (the top of Wave 1).

At this time, there are a lot of stops above the top of Wave 1.

Traders are not convinced of the upward trend and are using this rally to add more shorts. For their analysis to be correct, the market should not take the top of the previous rally.

Therefore, many stops are placed above the top of Wave 1.


The Wave 3 rally picks up steam and takes the top of Wave 1. As soon as the Wave 1 high is exceeded, the stops are taken out. Depending on the number of stops, gaps are left open. Gaps are a good indication of a Wave 3 in progress. After taking the stops out, the Wave 3 rally has caught the attention of traders.

The next sequence of events are as follows: Traders who were initially long from the bottom finally have something to cheer about. They might even decide to add positions.

The traders who were stopped out (after being upset for a while) decide the trend is up, and they decide to buy into the rally. All this sudden interest fuels the Wave 3 rally.

This is the time when the majority of the traders have decided that the trend is up.

Finally, all the buying frenzy dies down; Wave 3 comes to a halt.

Profit taking now begins to set in. Traders who were long from the lows decide to take profits. They have a good trade and start to protect profits.This causes a pullback in the prices that is called Wave 4.

Wave 2 was a vicious sell-off; Wave 4 is an orderly profit-taking decline.

While profit-taking is in progress, the majority of traders are still convinced the trend is up. They were either late in getting in on this rally, or they have been on the sideline.

They consider this profit-taking decline an excellent place to buy in and get even.


On the end of Wave 4, more buying sets in and the prices start to rally again.

The Wave 5 rally lacks the huge enthusiasm and strength found in the Wave 3 rally. The Wave 5 advance is caused by a small group of traders.

Although the prices make a new high above the top of Wave 3, the rate of power, or strength, inside the Wave 5 advance is very small when compared to the Wave 3 advance.

Finally, when this lackluster buying interest dies out, the market tops out and enters a new phase.


Elliott Wave Basics — Corrective Patterns
Corrections are very hard to master. Most Elliott traders make money during an impulse pattern and then lose it back during the corrective phase.

An impulse pattern consists of five waves. With the exception of the triangle, corrective patterns consist of 3 waves. An impulse pattern is always followed by a corrective pattern. Corrective patterns can be grouped into two different categories:

Simple Correction (Zig-Zag)
Complex Corrections (Flat, Irregular, Triangle)

Simple Correction (Zig-Zag)
There is only one pattern in a simple correction. This pattern is called a Zig-Zag correction. A Zig-Zag correction is a three-wave pattern where the Wave B does not retrace more than 75 percent of Wave A. Wave C will make new lows below the end of Wave A. The Wave A of a Zig-Zag correction always has a five-wave pattern. In the other two types of corrections (Flat and Irregular), Wave A has a three-wave pattern. Thus, if you can identify a five-wave pattern inside Wave A of any correction, you can then expect the correction to turn out as a Zig-Zag formation.

Fibonacci Ratios inside a Zig-Zag Correction
a

Wave B
Usually 50% of Wave A
Should not exceed 75% of Wave A
Wave C
either 1 x Wave A
or 1.62 x Wave A
or 2.62 x Wave A